


Overview:
Hotjar’s heatmap feature provides a compelling visual representation of user interactions on a website. It utilizes color-coded maps to vividly illustrate areas of high and low activity. This innovative approach transforms how user data is perceived and analyzed, offering a more intuitive way to understand user engagement on a site. Heatmaps are particularly effective in revealing where users are most likely to click, move, and scroll, providing a window into their preferences and behavior patterns.
Hotjar's heatmaps offer essential insights by simplifying user data interpretation, allowing quick identification of key webpage areas that attract attention or are missed. This data is crucial for optimizing layout, navigation, and content placement, leading to improved user experience, increased engagement, and higher conversion rates.
Before discussing Hotjar and the features of its heatmaps, however, what exactly is a heatmap? A heatmap is a visual tool that displays user behavior on a website, using color-coded graphics to show areas of high and low engagement, such as where users click, scroll, and hover.
Here's a breakdown of who needs Hotjar for its heatmap and why:

- User Experience (UX) Designers:
- Need: To visualize how users interact with website elements.
- Why: Heatmaps provide insights into user behavior patterns, like where users click most, how far they scroll, and which parts of a webpage attract the most attention. This data is crucial for optimizing layout and design elements and improving the overall user experience.
- Web Developers and Webmasters:
- Need: To identify usability issues and optimize website performance.
- Why: Heatmaps can highlight areas on a website that are problematic or confusing for users, allowing for targeted improvements and technical optimizations.
- Digital Marketers:
- Need: For data-driven decision-making in marketing strategies.
- Why: Understanding user engagement on different parts of a website, such as landing pages and call-to-action buttons, helps in refining marketing tactics and improving conversion rates.
- E-commerce Businesses:
- Need: To increase sales and reduce cart abandonment.
- Why: E-commerce sites use heatmaps to understand how customers interact with product pages and checkout processes, leading to design changes that simplify shopping experiences and encourage purchases.
- Product Managers:
- Need: To make informed decisions about product development and feature prioritization.
- Why: Heatmaps offer tangible evidence of how users interact with different features, helping in prioritizing development resources effectively.
- Content Creators and Digital Publishers:
- Need: To optimize content layout and placement.
- Why: For these professionals, heatmaps show which parts of their content are most engaging, allowing them to structure their articles or media in a way that maximizes reader retention and interaction.
And many more.
Steps for Creating a Heatmap Using Hotjar
- Sign up for Hotjar: If you haven’t already, create an account on Hotjar. Choose a plan that suits your needs; there are free and paid options available.
- Add Your Website: Once logged in, add your website to the Hotjar dashboard. You’ll need to provide basic information about your site.
- Integrade the Hotjar Tracking Code Snippet: To collect data, you need to install Hotjar’s tracking code snippet on your website. You can find this code on your Hotjar dashboard. Depending on your website platform (like WordPress, Shopify, etc.), the installation process may vary.
- Create a New Heatmap: In your Hotjar dashboard, navigate to the 'Heatmaps' section and click on ‘New Heatmap’. Give your heatmap a descriptive name for easy identification.
- Select Pages to Track: Choose which pages you want to track. You can track a single page, multiple pages, or use a pattern to track similar pages (like product pages on an e-commerce site).
- Configure Settings: Set up the specifics for your heatmap. This includes the device type (desktop, tablet, mobile), the sample size (how many pageviews to track), and other options based on your specific needs.
- Start & Wait Data Collection: Once you have configured the settings, start the data collection. Hotjar will begin tracking user interactions on the selected pages. However, you need to allow some time for Hotjar to collect enough data. The time required can vary depending on your website’s traffic and the sample size you’ve set.
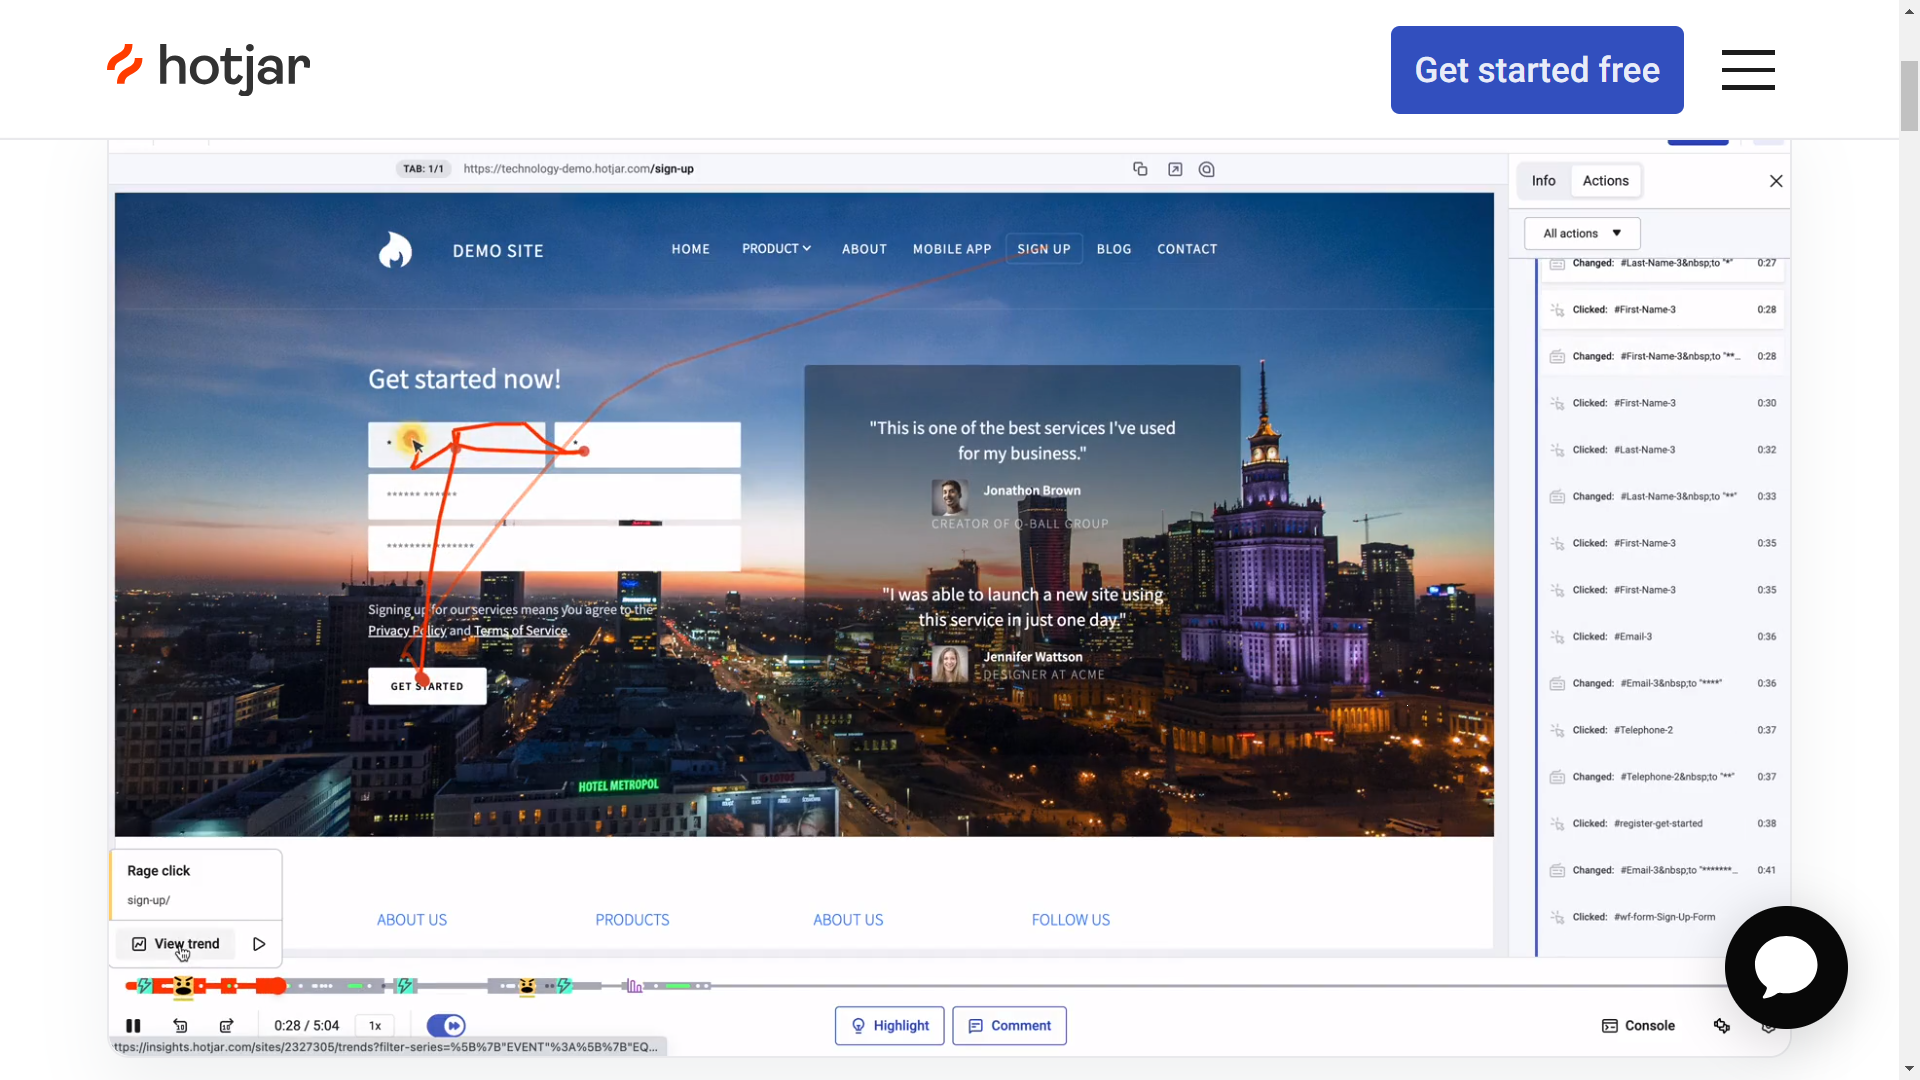
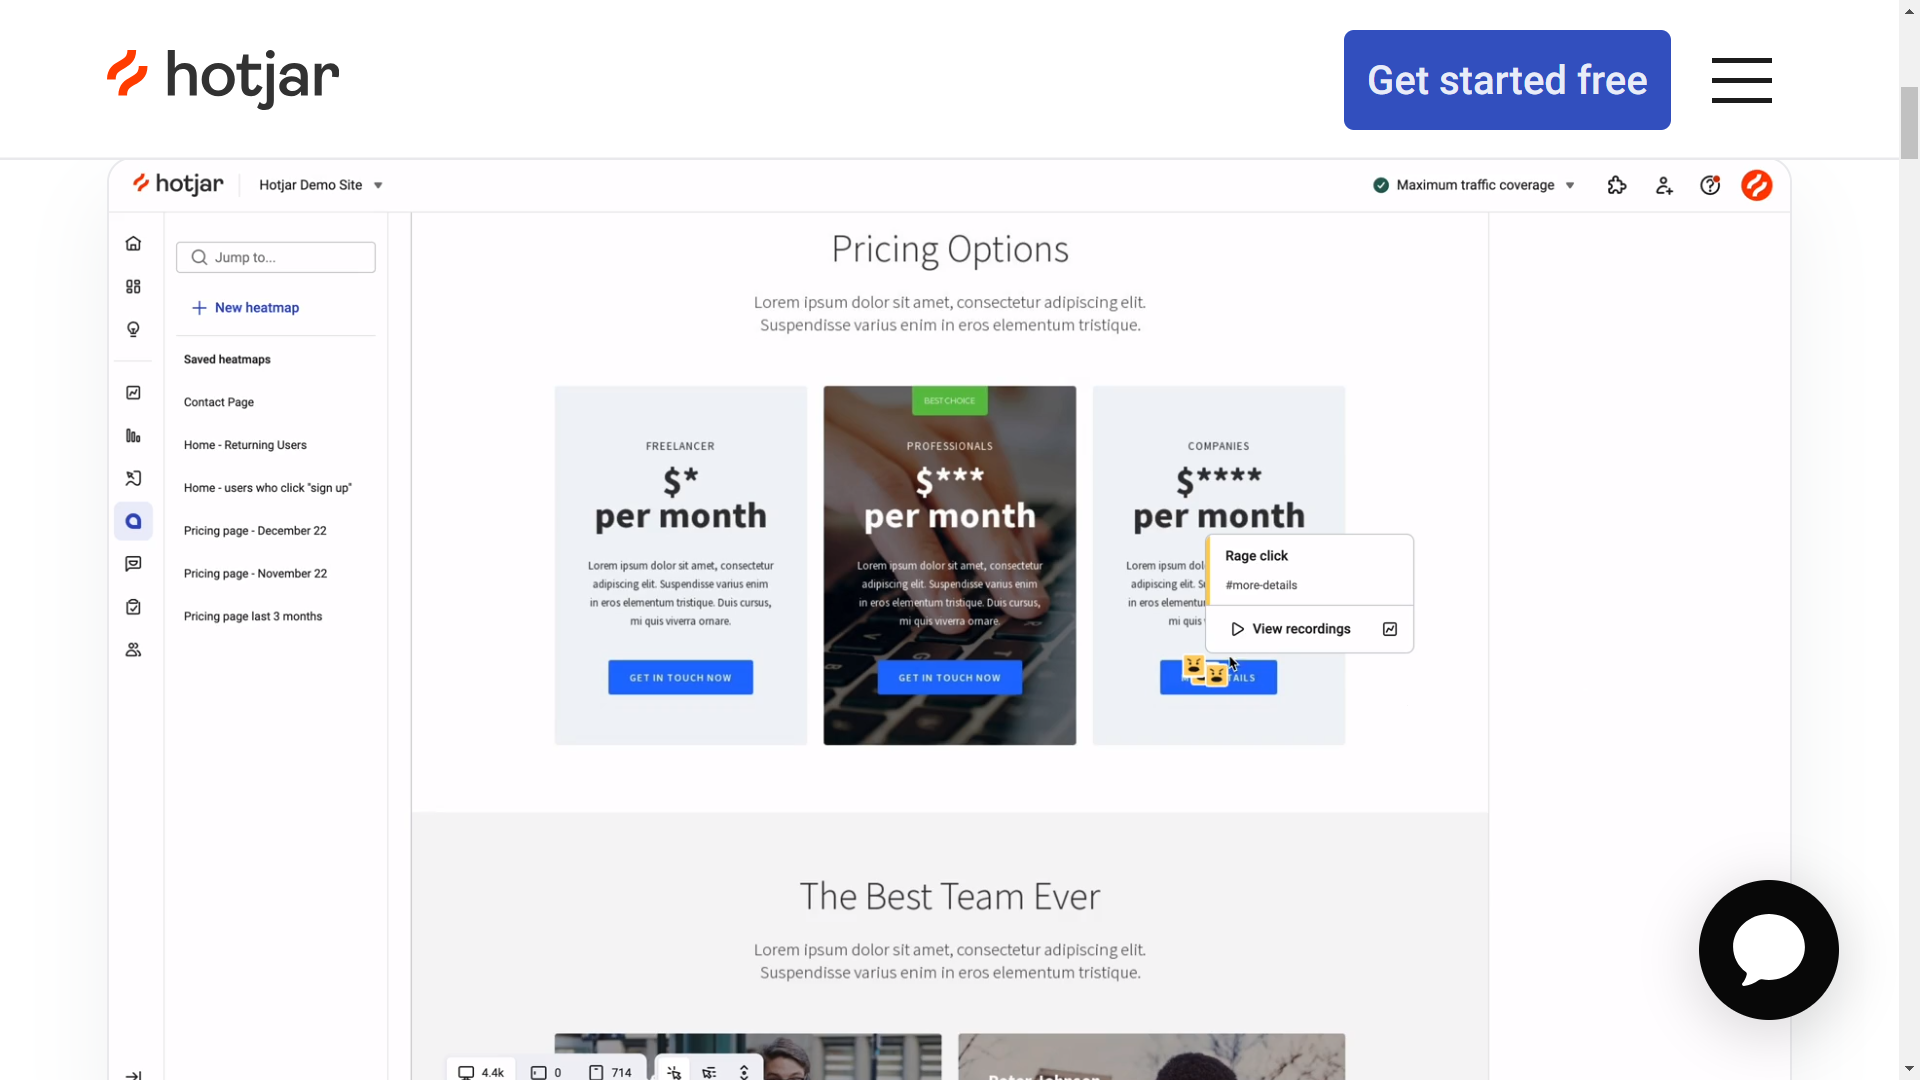
- Analyze the Heatmap: After collecting sufficient data, view your heatmap in the Hotjar dashboard. Analyze the color-coded visual data to understand user behavior on your page. Look for patterns in clicks, movements, and scroll depth.
- Make Data-Driven Decisions: Use the insights gained from the heatmap to make informed decisions about your website design. Identify which areas are attracting the most attention and which parts are being ignored.
- Iterate and Re-test: After making changes based on your heatmap insights, create new heatmaps to measure the impact of your changes. This iterative process helps in continuously optimizing the user experience.
Pros of Creating a Heatmap for Your Website

- Visual User Behavior Insight: Heatmaps provide an intuitive visual representation of how users interact with your website, making it easy to identify trends at a glance.
- Enhanced User Experience: By understanding what attracts users' attention, you can optimize webpage layouts, buttons, and content placement, leading to a better user experience.
- Data-Driven Design Decisions: Heatmaps offer empirical data that supports decision-making for design changes, rather than relying on guesswork or subjective opinions.
Cons of Creating a Heatmap for Your Website
- Limited Contextual Data: Heatmaps show where users click and scroll but don’t explain why users behave a certain way. The ‘why’ often requires additional qualitative research.
- Potential Misinterpretation: Without proper understanding, the data from heatmaps can be misinterpreted. For instance, a high number of clicks doesn’t always indicate a positive user interaction.
- Not All-encompassing: Heatmaps are most effective for analyzing visual elements and layout. Other aspects of user experience, like load time or functional errors, require different analytical tools.
Τhree key pros of creating a Heatmap using Hotjar:
- User-Friendly Interface and Easy Setup: Hotjar is designed with a user-friendly interface, making it accessible even for those who may not have extensive experience in web analytics. Setting up heatmaps is straightforward, and Hotjar provides clear instructions for installing the necessary tracking code on your website. This ease of use ensures that you can quickly start collecting valuable user interaction data without a steep learning curve.
- Detailed Visual Insights: Hotjar’s heatmaps offer rich, detailed visual insights into user behavior on your website. They show where users click, how far they scroll, and how they move their mouse across the page. This level of detail can uncover user preferences, highlight areas of interest, and reveal sections of your site that may need improvement. These insights are invaluable for optimizing page layouts, improving navigation, and ensuring key elements are effectively positioned.
- Segmentation and Specificity: Hotjar allows for segmentation in its heatmap analysis. You can create heatmaps for different user groups, devices (like mobile vs. desktop), or specific pages. This level of specificity means you can tailor your analysis to specific aspects of your user base or website, leading to more targeted improvements. This segmentation helps in understanding how different types of users interact with your site and can guide you in creating a more personalized user experience.
Hotjar's heatmap feature stands as a vital tool in the arsenal of any website owner, designer, or marketer seeking to deeply understand and improve user interactions on their site. By offering a user-friendly interface, detailed visual insights, and the ability to segment and specify analysis, Hotjar elevates the standard of website analytics. Whether it's enhancing the user experience, optimizing page layouts, or making data-driven decisions for content strategy, Hotjar’s heatmaps provide a level of insight that transcends traditional analytics.

